

INFORME DEL MERCADO INDUSTRIAL DE BIENES RAÍCES COMERCIALES DE DALLAS | MEDIADOS DE 2026
julio 29, 2026
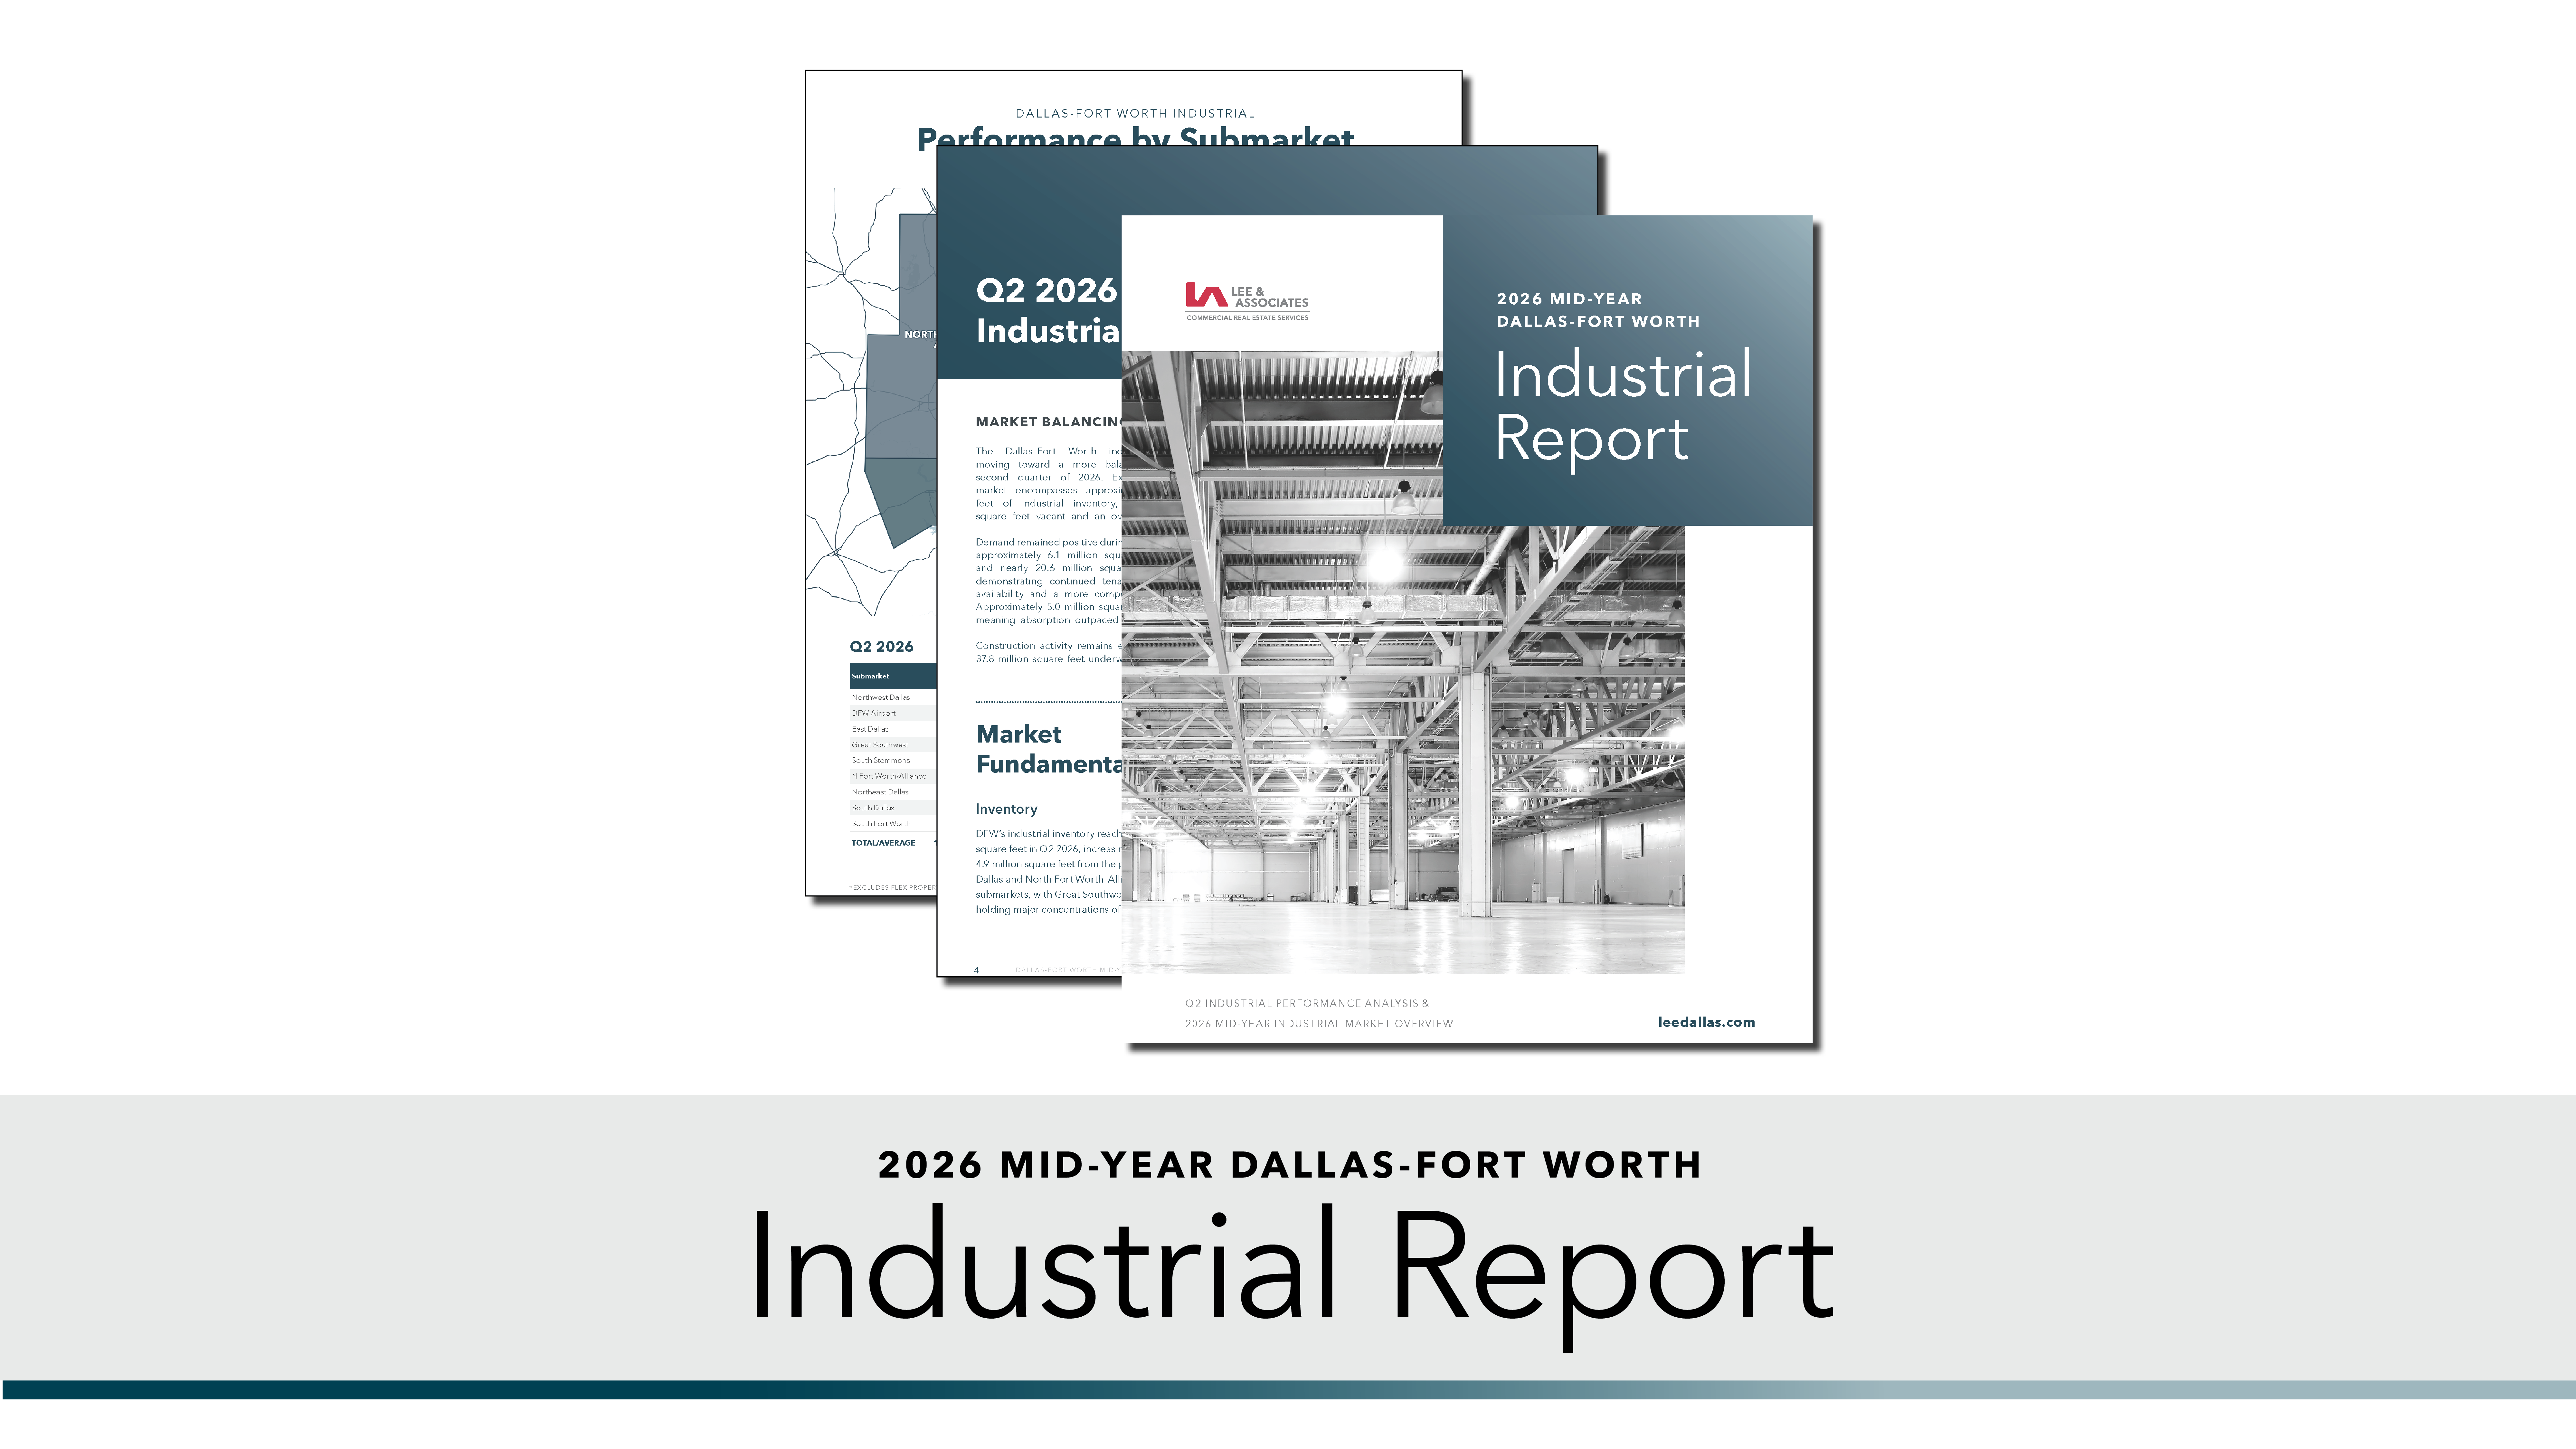
Informe del mercado industrial: panorama del mercado industrial de Dallas-Fort Worth a mediados de 2026
The Dallas-Fort Worth industrial market continued moving toward balance in Q2 2026. Excluding flex, inventory totaled approximately 1.10 billion square feet, with 96.0 million square feet vacant and overall vacancy at 8.7%. Demand remained positive, generating 6.1 million square feet of net absorption and 20.6 million square feet of leasing activity. With 5.0 million square feet delivered, absorption outpaced new supply.
Construction totaled 37.8 million square feet, led by North Fort Worth/Alliance, South Fort Worth and Northeast Dallas. Vacancy was highest in Northwest Dallas, East Dallas and South Fort Worth, while asking rents ranged from $6.45 to over $11.20 per square foot.
Vacancy and Absorption Trends
A mediados de 2026, el inventario industrial de Dallas-Fort Worth alcanzó aproximadamente 1.10 mil millones de pies cuadrados, sin considerar el producto flex. La absorción neta se mantuvo positiva, con un total aproximado de 17.1 millones de pies cuadrados durante el primer semestre del año, incluidos 6.1 millones de pies cuadrados en el segundo trimestre. La actividad de arrendamiento llegó a casi 20.6 millones de pies cuadrados, lo que demuestra una demanda sostenida de inquilinos pese a la mayor disponibilidad y al aumento de la competencia.
DFW Airport, Northeast Dallas, Great Southwest, and North Fort Worth-Alliance recorded the strongest absorption during the first half of 2026. South Dallas generated the highest leasing activity, followed by Great Southwest, North Fort Worth-Alliance, and DFW Airport. South Fort Worth recorded the largest decline in absorption.
Market-wide vacancy declined to 8.7% in the second quarter, down from 9.0% in the first quarter and 9.52% a year earlier. Approximately 96.0 million square feet remained vacant. Absorption outpaced the 11.1 million square feet delivered during the first half of the year, helping improve overall market balance. However, continued deliveries and lease-up activity may keep vacancy elevated in select submarkets.
Development and New Supply
Approximately 37.8 million square feet of industrial space was under construction at the end of the second quarter, up from approximately 35.7 million square feet in the previous quarter. North Fort Worth-Alliance accounted for the largest share of the pipeline, with 11.8 million square feet under construction, followed by South Fort Worth at 6.0 million square feet and Northeast Dallas at 5.2 million square feet.
Construction activity remains active but below earlier peak levels. Approximately 11.1 million square feet was delivered during the first half of 2026, including 5.0 million square feet in the second quarter. As new projects continue to deliver, competition is likely to remain strongest in submarkets with substantial construction pipelines or vacancy rates above 10%.
Rental Rates and Pricing
Average NNN asking rents across the metroplex ended the second quarter at $9.33 per square foot annually. Although rents declined modestly from $9.51 in the first quarter, they remained approximately 5.7% above the $8.83 recorded one year earlier. The quarterly decline suggests that pricing is beginning to stabilize, while year-over-year growth reflects continued demand for well-located industrial space.
Rental rates varied considerably by submarket. DFW Airport and Northwest Dallas recorded the highest average asking rents at $11.28 and $11.25 per square foot, respectively, followed by Northeast Dallas at $11.24. Supply-constrained and infill locations continued to command premium pricing, while South Dallas and South Fort Worth offered lower average rents at $6.45 and $7.27 per square foot.
Summary and Outlook
El Informe del Mercado Industrial de mediados de 2026 indica que el mercado industrial de Dallas-Fort Worth continúa estabilizándose. La absorción positiva, casi 20.6 millones de pies cuadrados de actividad de arrendamiento y una tasa de vacancia por debajo del 9% apuntan a una demanda sólida de inquilinos. Al mismo tiempo, el portafolio en construcción de casi 37.8 millones de pies cuadrados sigue siendo un factor relevante conforme los nuevos proyectos se entregan y avanzan en su comercialización.
Market performance is expected to remain uneven across the region. Submarkets with significant construction pipelines or vacancy above 10% may experience greater leasing competition, while established locations with lower vacancy should remain comparatively resilient. Modern, well-located facilities offering efficient layouts and strong transportation access are likely to continue outperforming as tenants benefit from a broader range of available options.
Descargar: Informe del Mercado Industrial
Click here para descargar el Informe del Mercado Industrial de mediados de 2026.